
Monthly Insights & Outlook — At a Glance (October 14, 2026)
Oct 16, 2026, 11:00 AM GMT-4 | By Ioana Barza & Dave Puchowski | KBRA DLDTrends: September volume totaled $10.4 billion, the lowest September since 2021, down 7% from $11.3 billion in August and 66% from $30.9 billion in September 2025.
Software volume fell sharply in 3Q26 led by declines in activity from issuers with EBITDA of $50m+ while spreads gapped to 50 bps over non-software tech.
Average LBO spreads sit 40 bps above the February low while equity contributions rose to 67% in 3Q.
Proceeds: Issuance remained subdued in September, despite increases in LBO and refinancing volume from August lows. LBO volume rose to $4.7 billion from $4.0 billion in August but remained well below the $11.8 billion recorded in September 2025.
Refinancing volume increased to $3.6 billion from $2.0 billion while add-on M&A fell sharply to $1.9 billion from $3.8 billion.
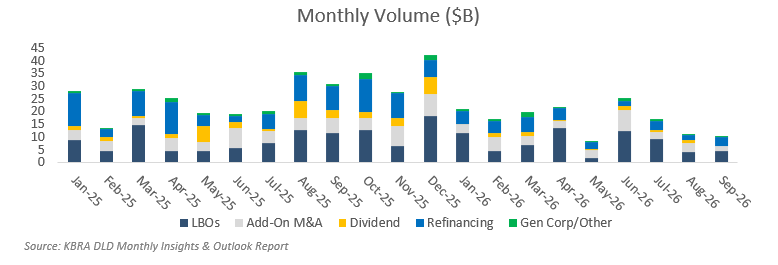
The continued slowdown brought 3Q26 volume to $38.9 billion, the lowest quarterly total since 2Q23.
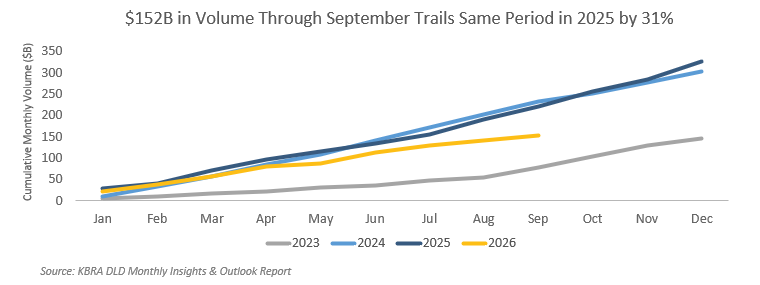
Volume through the first half of 2026 was down just 16% from the same period in 2025, but the weak third quarter widened the year-to-date shortfall to 31%, or $69 billion, through September.
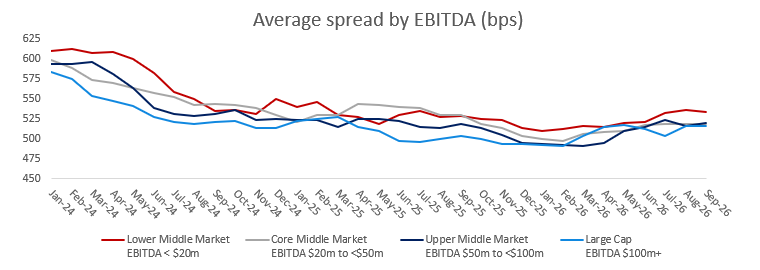
Private Spreads by EBITDA: Spreads remained elevated across all market segments, ranging 21 to 28 bps above their respective 1Q lows.
Private vs. Public Spread Premium: Private Large Cap spreads held steady at S+516 in September, while the premium over single-B spreads increased to 177 bps, 12 bps above the rolling two-year average.
Want to see more news, data, and research on the direct lending market? Click here to request a complimentary trial of DLD and explore the breadth and depth of our content.
UMM & Large Cap LBOs: Total leverage declined to 4.6x in September from 4.8x in August with fewer Software deals while leverage on non-Software LBO deals has also tightened. Spreads widened 10 bps to S+512 in September, their highest since February 2025.
Core MM LBOs: Total leverage fell a half-step to 4.3x in September after averaging between 4.7x–4.8x over the previous five months. The September deal mix included sectors with typically lower leverage, contributing to the decline. Spreads widened 10 bps to S+510.
Lower MM LBOs: Total leverage remained tighter at 3.8x in September. LBO spreads widened 4 bps to S+528, a two-year high.
Defaults: The trailing 12-month default rate declined to 2% from 2.2% last month while the non-accrual rate remains at 1.8%.
Sectors: Commercial Services accounted for a record 31% of U.S. direct lending deals through 3Q26, up from 23% in 2025. The sector's growing share was evident across all EBITDA sizes.
Industrial Manufacturing was the only other sector to gain share, rising to 9% from 7% in 2025. Technology's share of deals declined to 15% from 19% in 2025 and accounted for just 12% of total deal count in 3Q.
Outlook: Monthly issuance averaged $16.9 billion through September 2026 compared to $25 billion in the same period last year. At the 2026 run rate, volume would finish year around $200 billion, 38% below 2025.
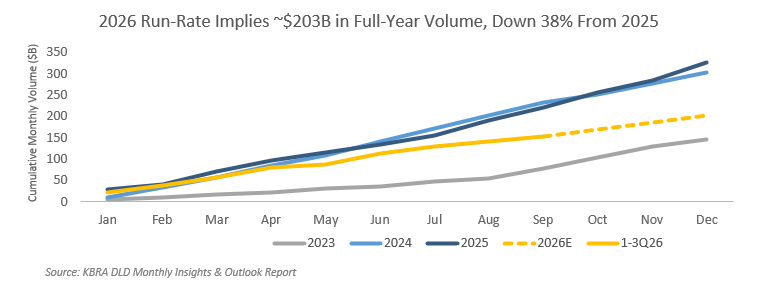
The turnaround in issuance seen in August and September last year did not materialize. Notably, $171 billion in volume during the last five months of the year boosted 2025 levels to $326.5 billion.
— Ioana Barza / Dave Puchowski