
Credit Unions Record Strong Growth in Commercial, Real Estate Lending
Oct 07, 2026, 12:00 PM GMT-4 | By Frank GarganoThe latest findings from the National Credit Union Administration’s (NCUA) quarterly credit union data summary show that while the industry overall continues to perform well, consolidation and closures remain constant.
KBRA Financial Intelligence’s (KFI) analysis of the credit union industry at large highlights how assets, outstanding loans, and shares and deposits have all seen quarter-over-quarter (QoQ) growth for the first two periods of the year, but tallies of federally insured credit unions and institutions with a low-income designation have continued to shrink over the past several periods.
Toward the end of his tenure as chairman of the NCUA, Kyle Hauptman led the agency’s efforts to streamline the chartering process. In March, the NCUA released a modified Phase 1 system for new charter applications as part of a broader effort to fully automate processing charter applications in 2027.
“Streamlining and systematizing the chartering process, as well as reducing unnecessary requirements, represents meaningful progress in easing the burden on organizers who want to establish a new credit union,” Hauptman said in a press release. “Anyone who seeks to form a credit union should have a fair and accessible opportunity to do so.”
Alongside this effort, the NCUA announced in June that it updated its Consumer Access Process and Reporting Information System (CAPRIS) to handle a greater volume of applications and support requests from common bond federal credit unions to “add occupational and associational groups of any size,” according to the release. Both efforts seek to stem the flow of closures across the industry.
Below, we summarize the top findings from the NCUA and highlight the most important takeaway for credit union leaders.
Performance by the Numbers
Assets
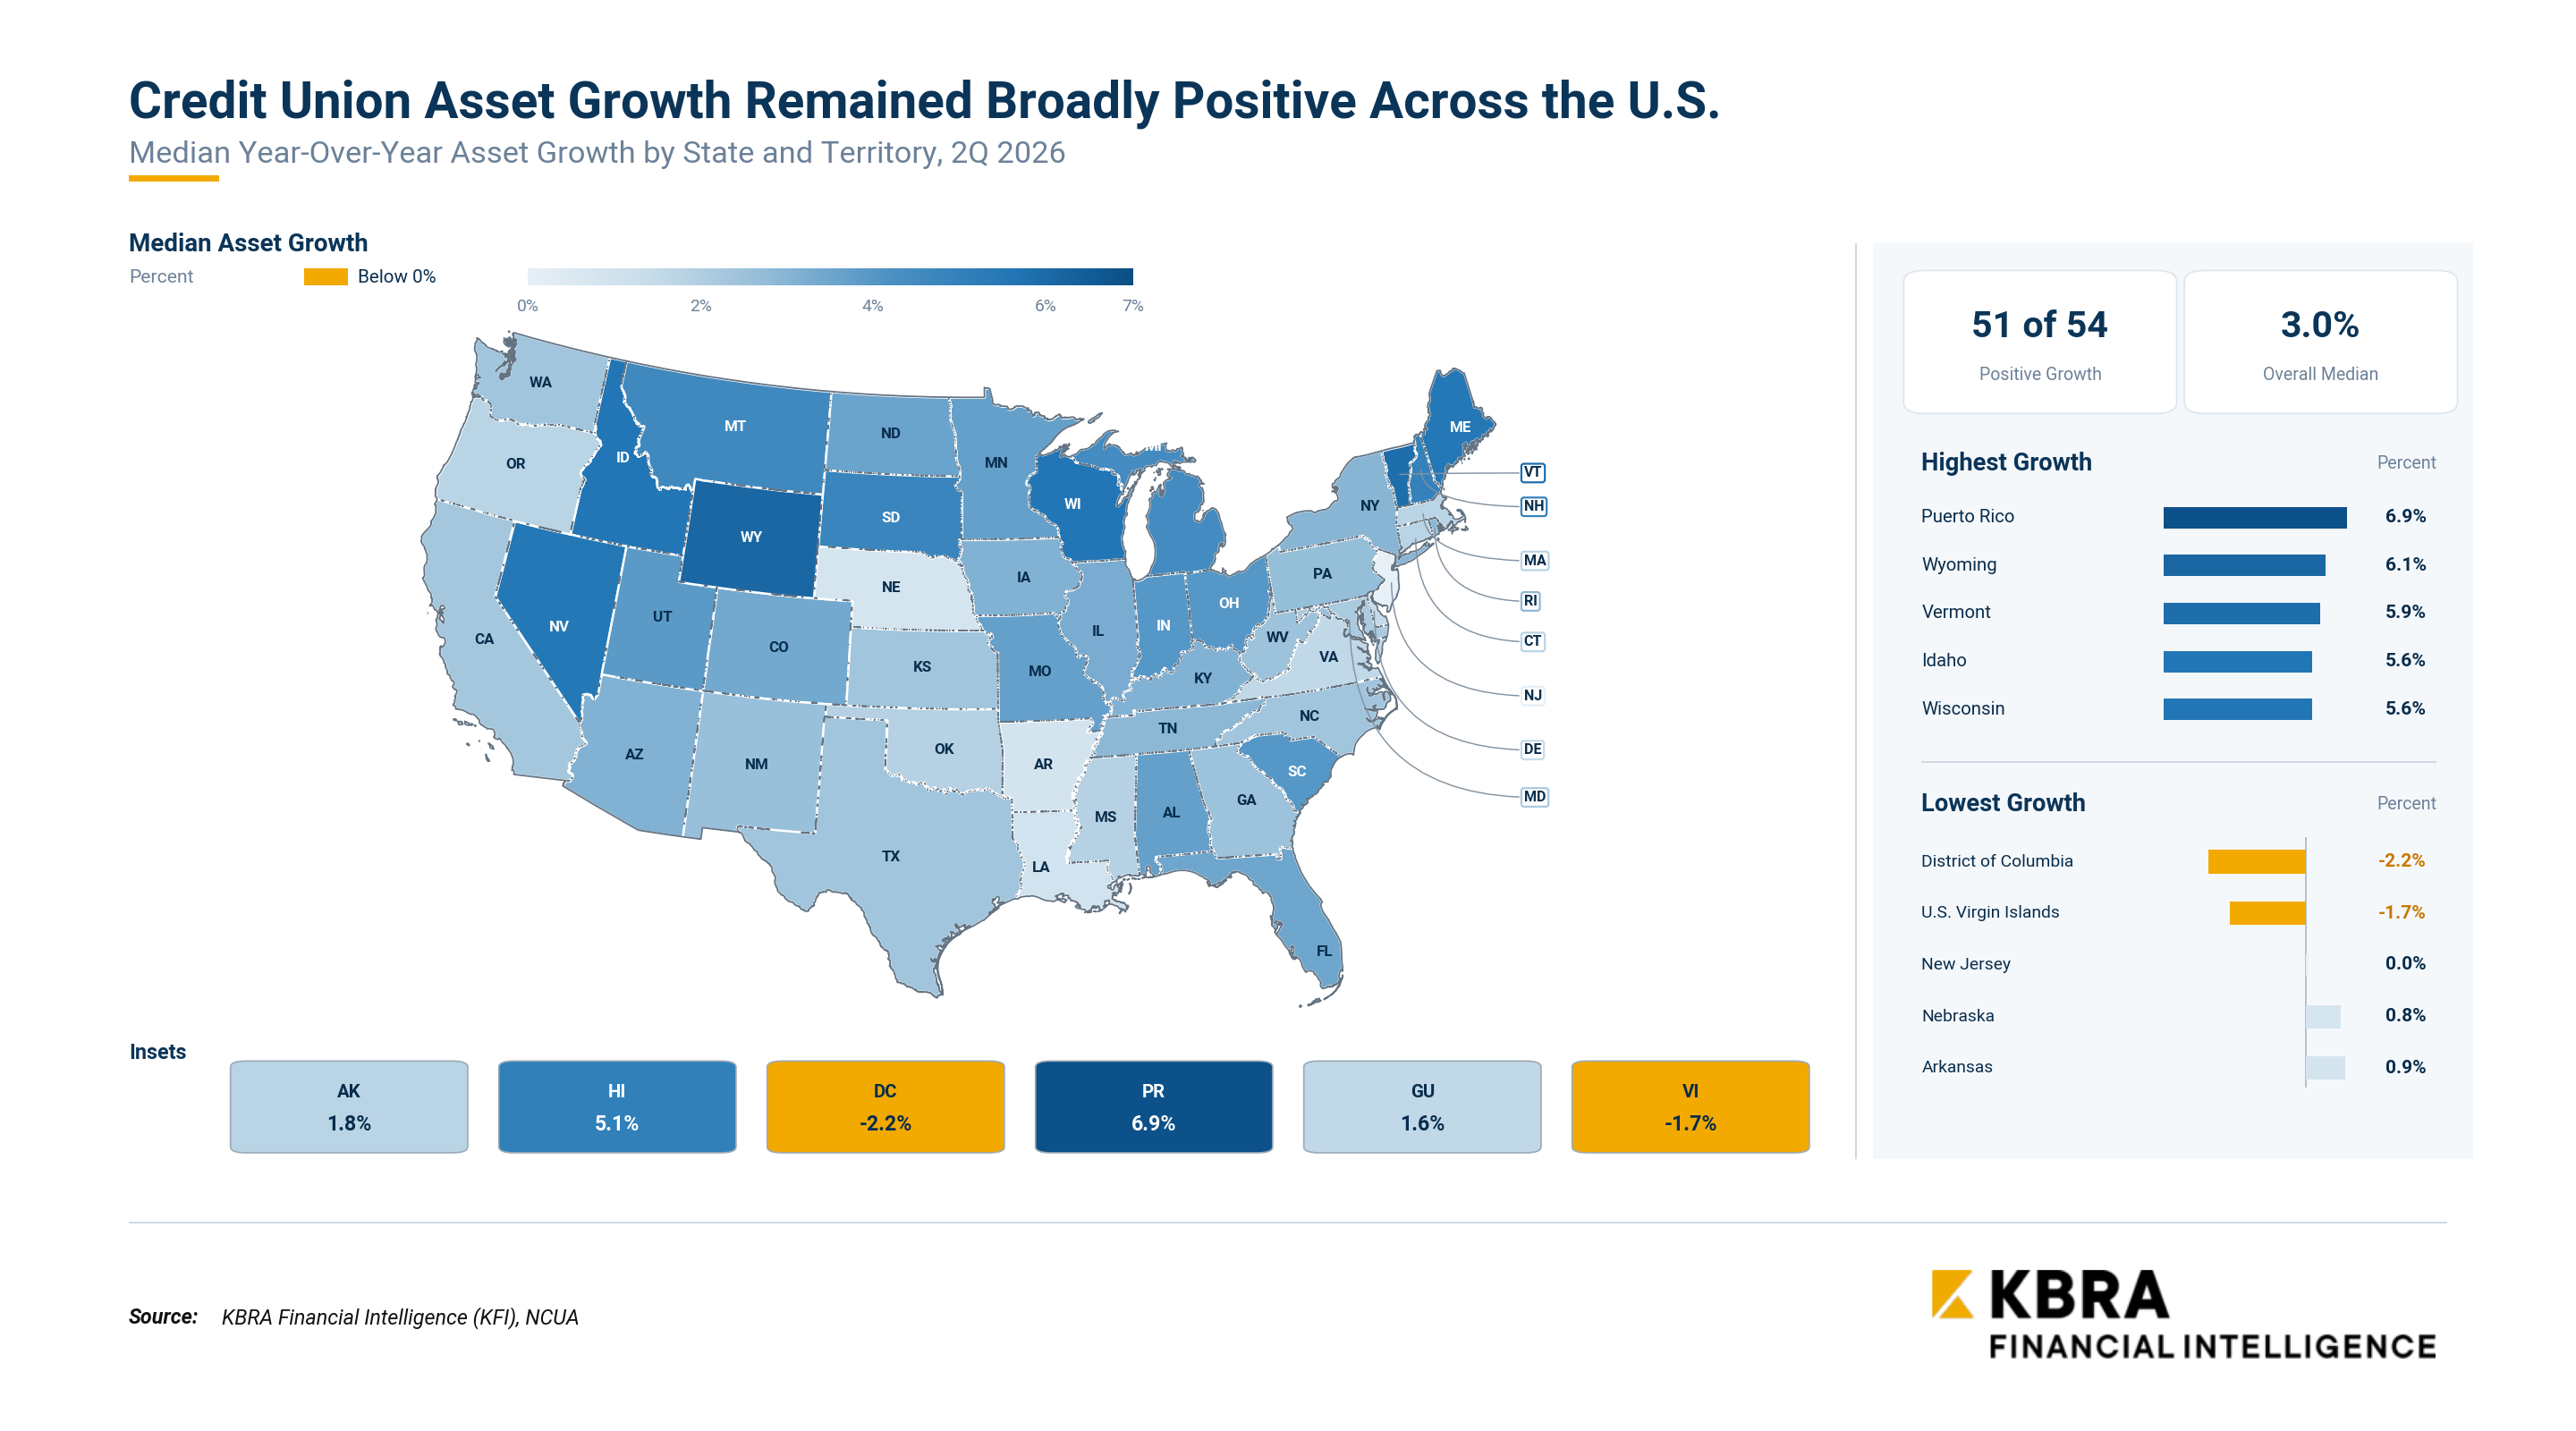
Credit union assets were $2.5 trillion for 2Q, up 60 basis points (bps) from the prior quarter and more than 5% from the year-ago period’s $2.38 trillion.
Looking at the breakdown of asset performance, we see that the year-over-year (YoY) growth in total loans of $82.2 billion accounted for roughly 70% of the overall $119.9 billion YoY in total system asset growth for 2Q. Total investments also increased by close to $29 billion across the same period, with intermediate three-to-five-year maturities posting the biggest growth. Cash declined $4.8 billion YoY.
Overall median assets for the 12-month period ending June 30 grew by 3%, from 2.5% for the same period ending June 30, 2025. Puerto Rico was the region that recorded the highest growth in median assets among credit unions at 6.9%, followed by Wyoming at 6.1%, Vermont at 5.9%, Idaho at 5.6%, and Wisconsin at 5.6%.
Washington, D.C., was one of two that saw a drop in median assets at 2.2%, with the U.S. Virgin Islands being the other at 1.7%. Other notable regions include New Jersey, which recorded no change in median assets, Nebraska with 0.8% growth, and Arkansas with 0.9% growth.
Why this is significant: This could suggest that credit union leaders are mobilizing balance sheet liquidity into securities and lending portfolios, rather than stockpiling cash.
Loans
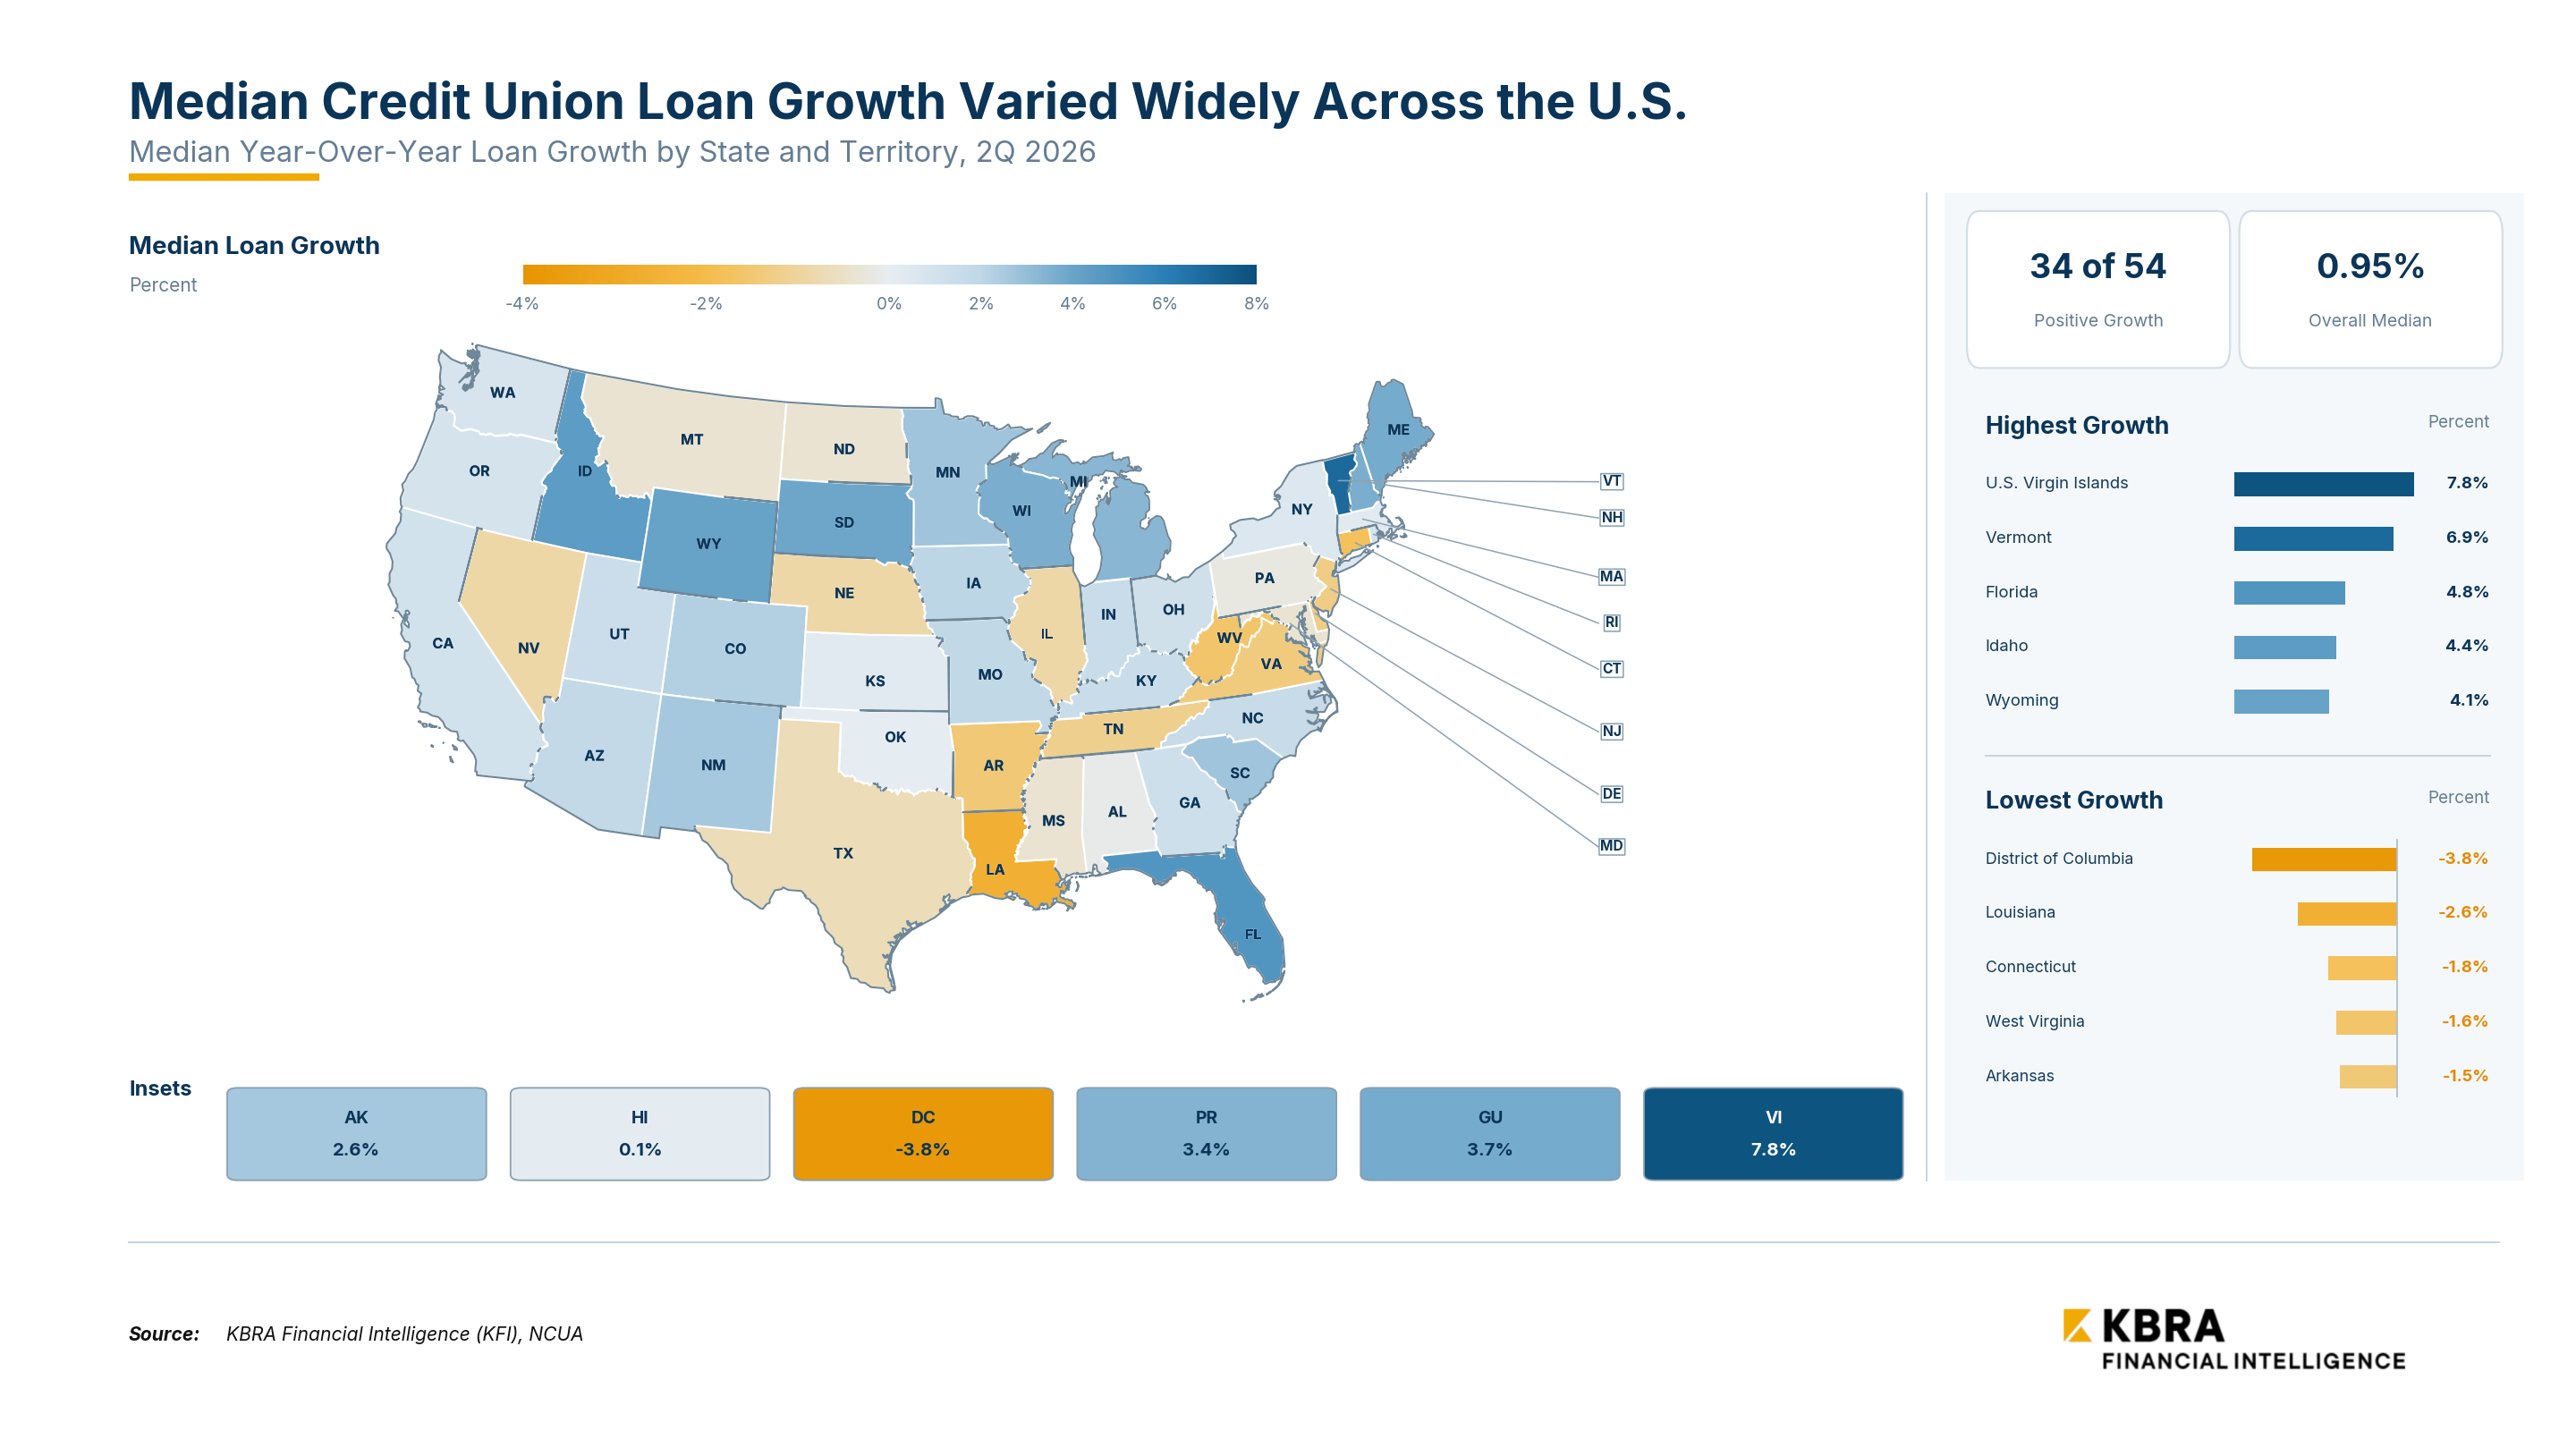
Credit union loans were $1.76 trillion for 2Q, a nearly 2% increase from the prior quarter’s $1.73 trillion and a 4.9% YoY jump from 2Q 2025’s $1.68 trillion.
Breaking down total loans per reported category, 1-4 family residential loans grew by $60.6 billion YoY, which amounts to roughly 74% of the entire YoY increase in total loans. Combined with the $18.5 billion increase in commercial lending, the two categories were the strongest-performing areas of lending for credit unions.
By comparison, auto lending—which has always been a crucial line of business for credit unions—was relatively flat YoY as used auto loans were up $3.8 billion against a $1.8 billion decrease in new auto loans.
Overall median loan growth across the same period was 95 bps, as a smaller share of states recorded institutions with positive growth in loan balances. The U.S. Virgin Islands was the region with the greatest growth at 7.8%, followed by Vermont with 6.9%, Florida with 4.8%, Idaho with 4.4%, and Wyoming with 4.1%.
D.C. recorded the greatest decrease in median loan growth at 3.8%. Close behind were Louisiana with 2.6%, Connecticut with 1.8%, West Virginia with 1.6%, and Arkansas with 1.5%.
Why this is significant: Industry-wide loan performance suggests that credit union loan growth is increasingly being supported by real estate and commercial lending rather than traditional auto lending.
Shares and Deposits
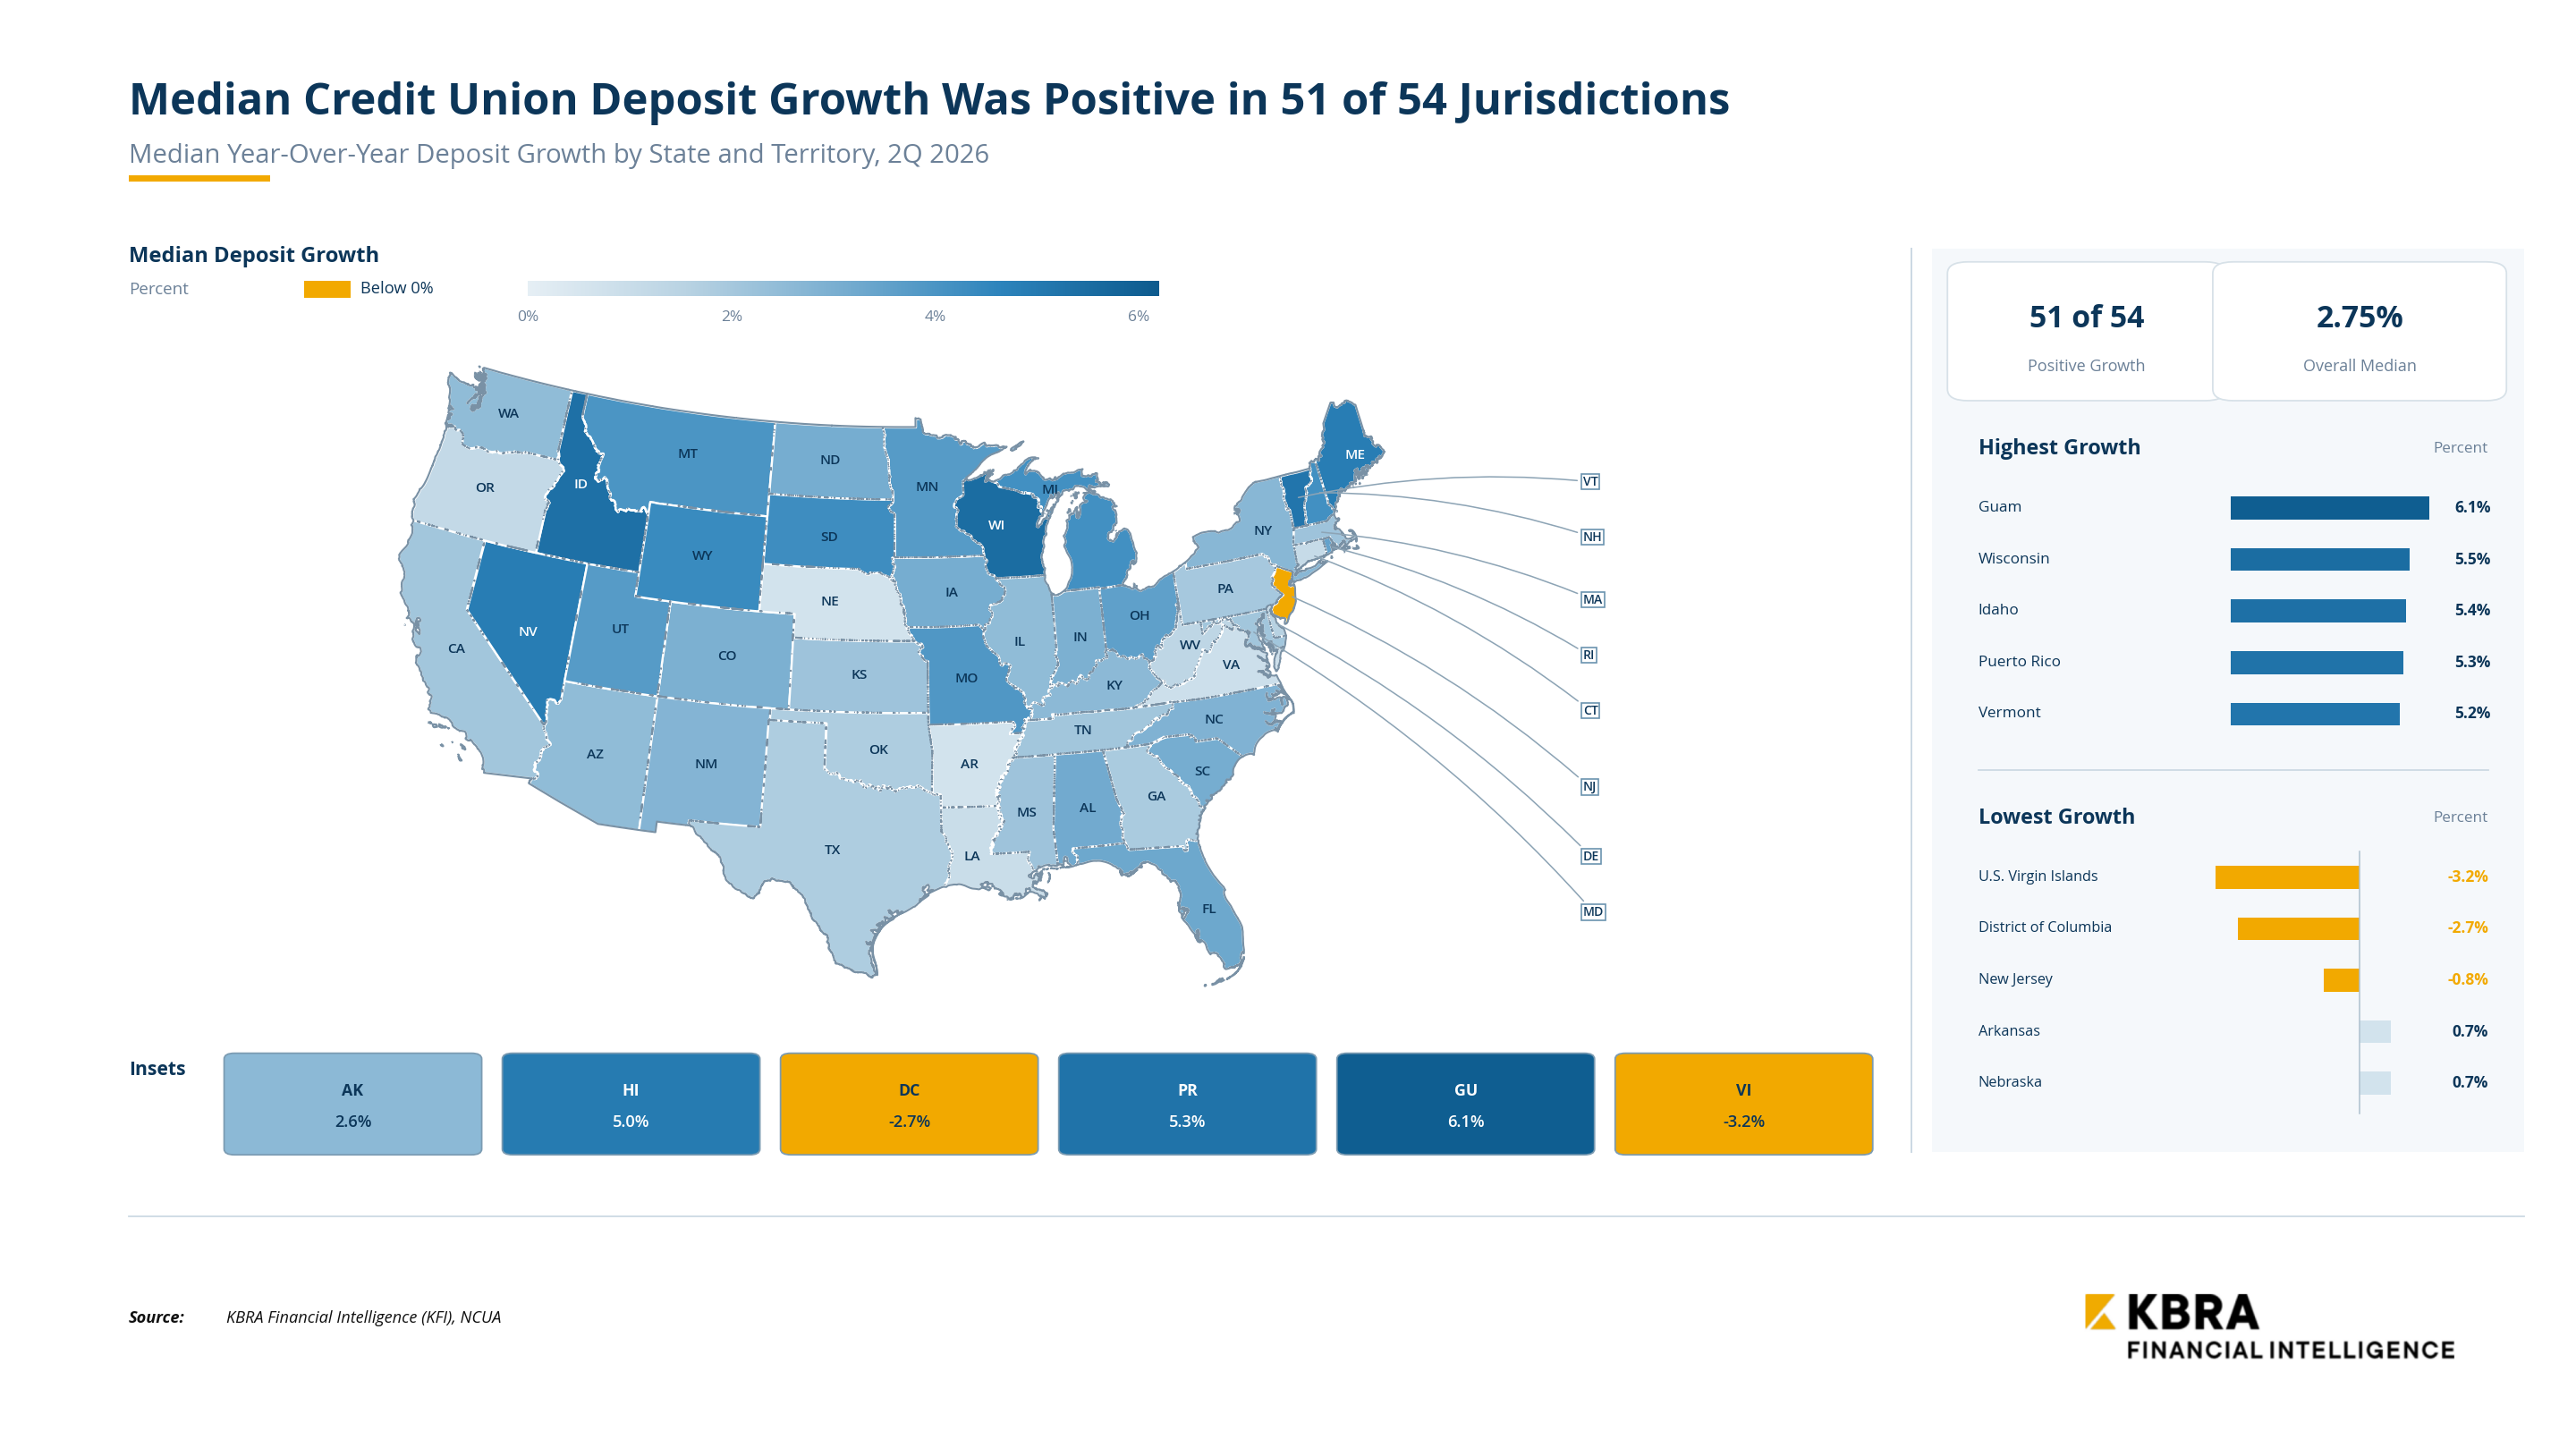
Credit union deposits were $2.13 trillion for 2Q, up slightly (20 bps) from last quarter’s $2.12 trillion and 5% higher than the year-ago figure of $2.02 trillion.
Share drafts grew by 6% or $105 billion YoY, while regular shares were up 2.6% or roughly $15.2 billion. The important category to note here, though, is other deposits, which was up 6.3% or $66.5 billion YoY.
Money market accounts and share certificate accounts were the strongest performing products within that category for the period, reporting $31.7 billion and $34.2 billion increases respectively. Combined, they accounted for roughly 63% of the overall growth in total shares and deposits.
Overall median deposits were up 2.75% over the last 12 months, with 51 of 54 regions recording positive growth. Guam was the top with 6.1% growth, followed by Wisconsin with 5.5%, Idaho with 5.4%, Puerto Rico with 5.3%, and Vermont with 5.2%.
The U.S. Virgin Islands recorded the greatest decrease in median deposits at 3.2%, followed by D.C. at 2.7%, and New Jersey at 0.8%. Arkansas and Nebraska were the states with the lowest positive growth, both with 0.7%.
Why this is significant: The numbers support the trend that members continue to prefer higher-yielding deposit products, particularly money markets and certificates, over basic regular shares.
Mergers and Acquisitions (M&A)
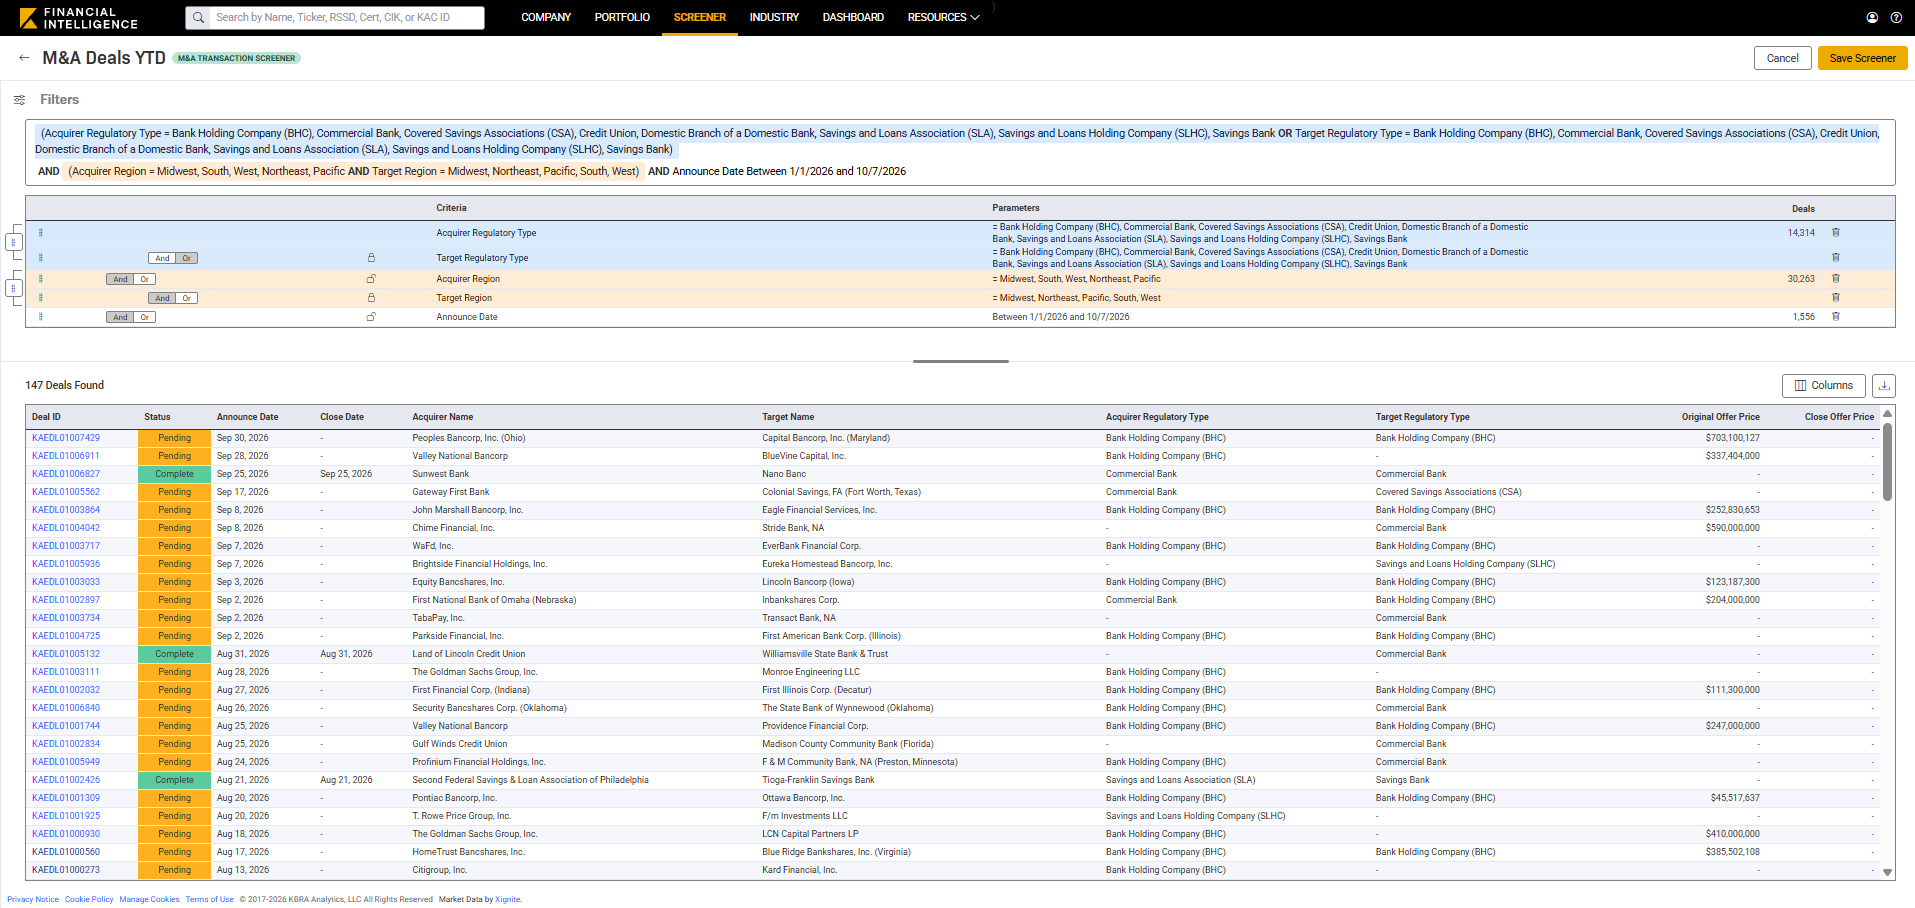
The NCUA recorded 51 proposed credit union-to-credit union mergers open to comment for the first half of the year, with a further 37 identified since then.
The greatest by combined assets within the range was the combination of the Washington Terrace, Utah-based Goldenwest Credit Union (KFI Score: B+) and the Ogden, Utah-based Ascent Federal Credit Union (KFI Score: B-), which, following the May 14 approval of the deal, yielded a combined institution with roughly $4.2 billion of assets.
Why this is significant: The NCUA has made steady progress toward improving the efficiency and speed with which the agency processes potential mergers and new charters, seeking to improve the rate of new charters.
KBRA Financial Intelligence (KFI) now provides integrated M&A data throughout the platform, allowing users to research transactions across individual institutions while also monitoring broader industry activity. If you are interested in a live demonstration or have questions about these features, please reach out to the KFI team at [email protected].
Note: Commentary and opinions expressed by individuals who are not affiliated with KBRA Analytics do not necessarily reflect the views of KBRA Analytics, KBRA, or their employees. Such commentary is included solely to provide relevant industry perspectives.