
KFI’s Quarterly Banking Overview: 2Q 2026
Aug 19, 2026, 12:00 PM GMT-4 | By Frank GarganoBanks reported another solid quarter of economic growth, spanning loan and deposit balances, revenue and total assets, and a decline in total debt-to-total equity ratios. These are the high points we explore in this quarter’s edition of KBRA Financial Intelligence’s (KFI) Quarterly Banking Overview.
The Growth of Mortgage and Construction Lending in Bank Portfolios
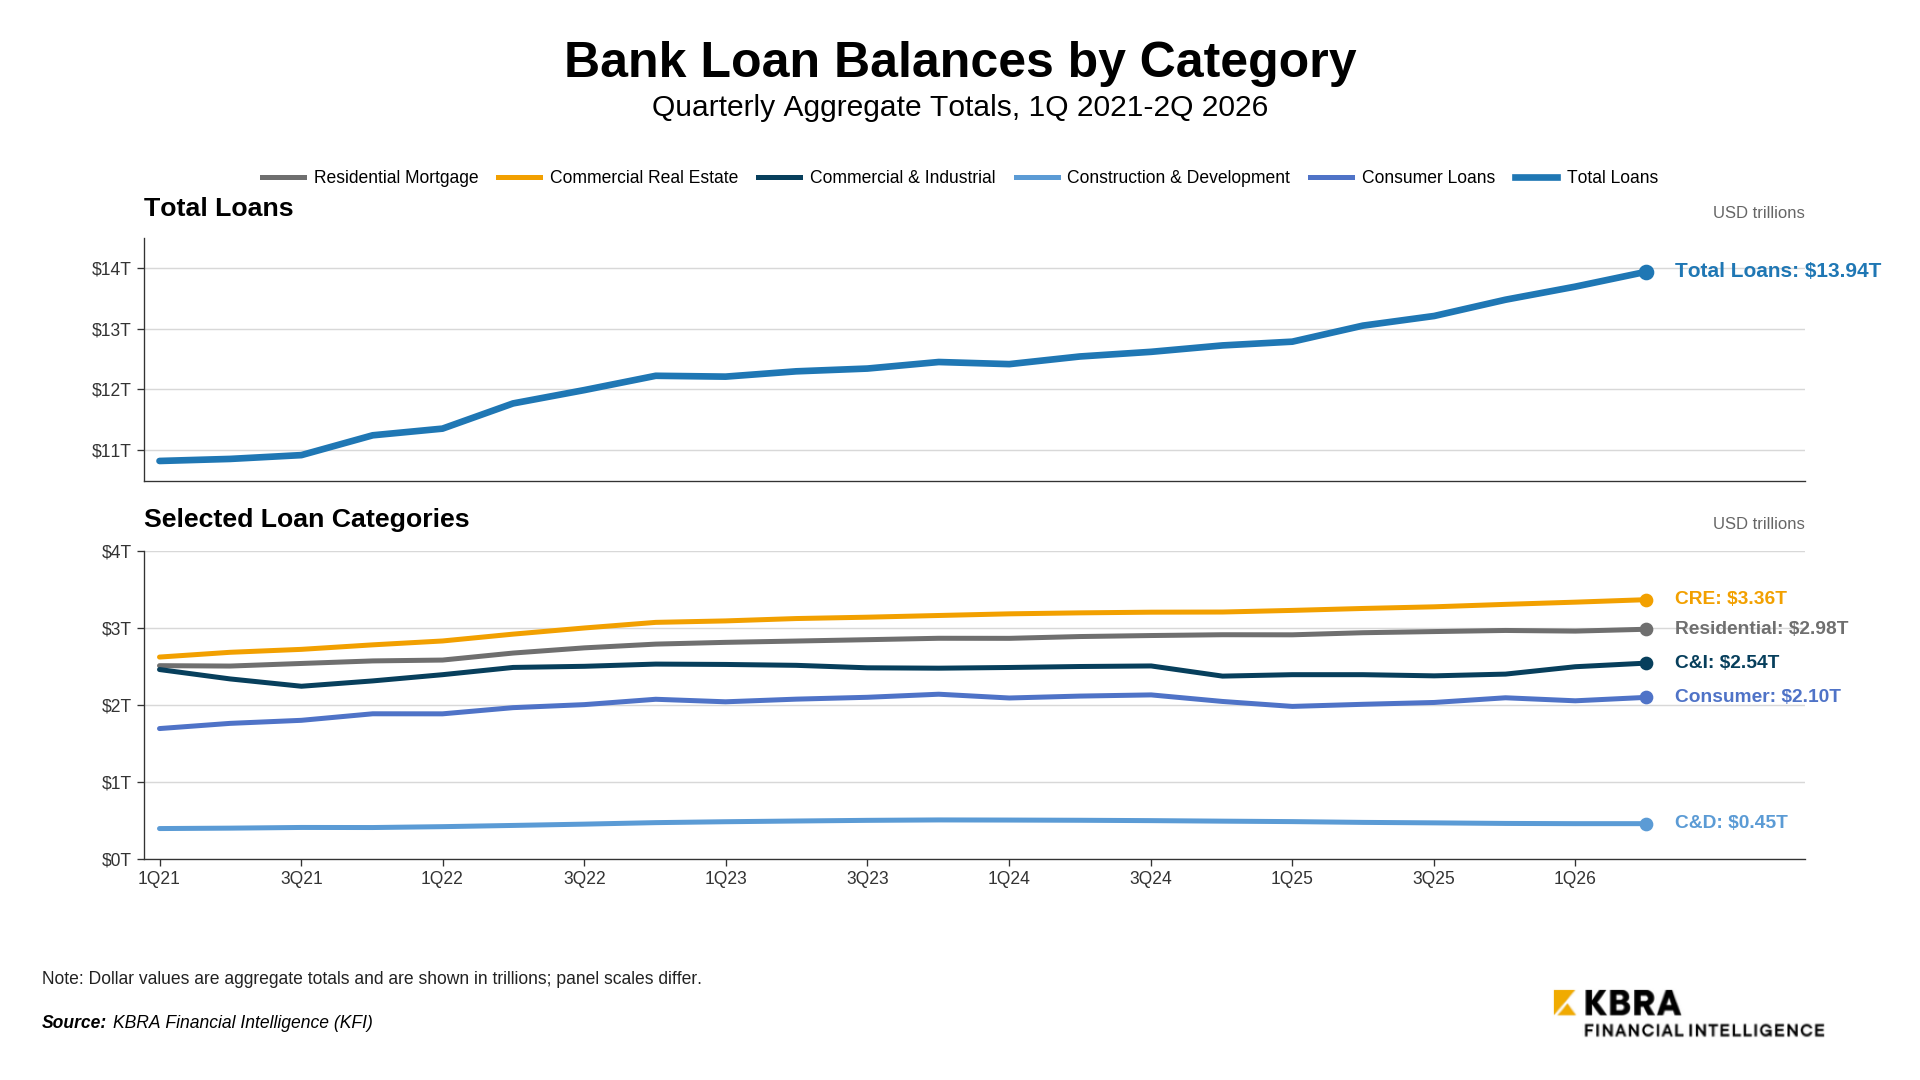
Total bank loans reached $13.9 trillion in 2Q 2026, up 1.8% from the previous quarter and 6.8% from the year-ago period.
Most lending categories reported notable quarter-over-quarter (QoQ) growth: residential mortgage at 0.81%, consumer loans at 2.16%, commercial and industrial (C&I) loans at 1.87%, and commercial real estate (CRE) loans at 0.96%. Construction and development (C&D) lending was roughly flat, with 0.03% growth from the prior quarter.
Compared to the year-ago period, residential mortgage lending was up 1.53%, consumer lending was up 4.49%, C&I lending was up 6.27%, and CRE lending was up 3.51%. C&D lending was the notable exception, reporting a decline of 3.49% year-over-year (YoY).
Deposits, Revenue, and Total Assets All Show Positive Performance
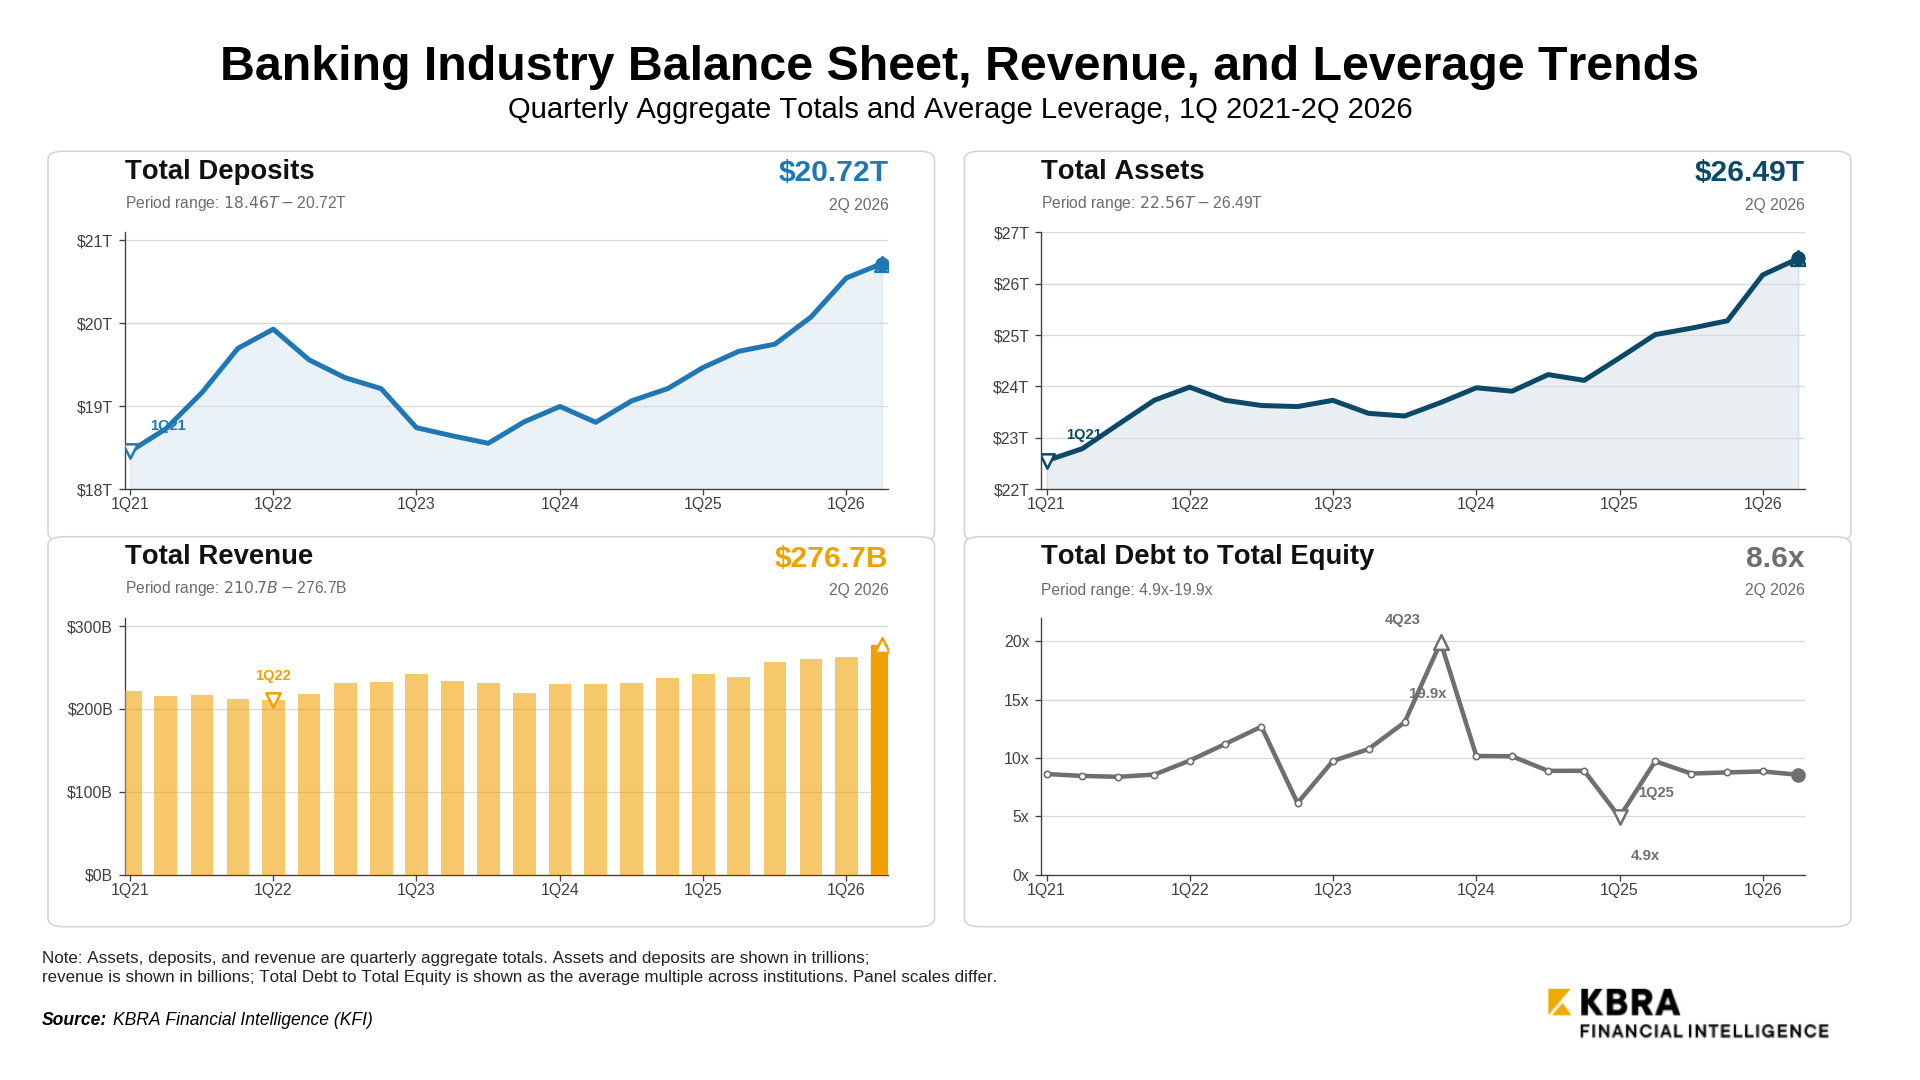
Total bank deposits reached $20.7 trillion in 2Q 2026, up just under 1% from the prior quarter’s $20.6 trillion and up 6.78% from $19.7 trillion in the year-ago period.
Bankers could start to see some of these numbers shift noticeably through the remainder of the year and beyond due to a host of provisions included in last month’s passage of the 21st Century ROAD to Housing Act.
The housing package included measures to raise the amount of reciprocal deposits that insured depository institutions can accept and establish a tiered system where that amount is dependent on an institution’s total liabilities. These provisions originated in last year’s H.R.3234 – Keeping Deposits Local Act, but failed to gain any traction until this year.
Applicable to well-capitalized banks and institutions with a CAMELS rating of 1, 2, or 3, the old limit of $5 billion or 20% of an institution’s total liabilities was replaced with the following breakdown: 50% of the first $1 billion in total liabilities; 40% of total liabilities between $1 billion and $10 billion; and 30% of total liabilities between $10 billion and $250 billion.
As of 2Q, total reciprocal deposits for banks were $481.1 billion, a 3.96% increase from last quarter’s total of $462.8 billion and a 12.18% jump from the year-ago period.
Total assets and total revenue continued to climb on a quarterly basis, with assets up 1.23% and revenue up 5.14%. YoY, both metrics were up 5.93% and 16.25%, respectively.
Total debt to total equity among U.S. banks declined to 8.56x from 8.85x the prior quarter and 9.72x one year ago.
The metrics above, as well as all data reported by U.S. banks in Federal Financial Institutions Examination Council (FFIEC) Call Reports, Uniform Bank Performance Reports (UBPR), and generally accepted accounting principles (GAAP) financials, can be identified and downloaded using the Data Wizard in KFI’s Excel add-in. To access our full library of KFI Scores and data tools, request a demo with KFI.
In Case You Missed It
Follow KFI Insights for our latest research, data analytics, and product updates. Read our research reports utilizing data from 10,000 banks, credit unions, and more. Some of our recent analysis highlights include the following:
Could a Soft Jobs Report Fuel Talk of a Rate Hike in the Near Future?
Top Takeaways From the Fed’s Beige Book
Federal Reserve Holds Rates Steady Despite Tariff Pressures
Note: Commentary and opinions expressed by individuals who are not affiliated with KBRA Analytics do not necessarily reflect the views of KBRA Analytics, KBRA, or their employees. Such commentary is included solely to provide relevant industry perspectives.